TL;DR — Google Analytics can't see AI answers. Build a proper AEO measurement stack: 20–40 buyer-intent prompts × 5 engines × weekly, tracking mention rate, citation share, sentiment, prompt coverage, and engine drift.
The measurement gap
Google Analytics does not know that ChatGPT recommended your competitor 40 times last week. Search Console does not tell you Perplexity is citing your comparison page 3x more than your homepage.
If AI answers are influencing purchases — and they are — you need a new instrumentation layer.
The metrics that matter
Mention rate. Across a fixed set of buyer-intent prompts, what percentage of the time is your brand mentioned? Baseline it, then trend it.
Citation share. Of all citations for a given prompt across engines, what share do you own? A pure quality signal.
Sentiment. Are you mentioned as the winner, a challenger, or a caveat? Big difference.
Prompt coverage. Across your target prompt universe, what share of prompts mention you at all? Coverage before depth.
Engine drift. How does your visibility differ across ChatGPT, Gemini, Perplexity, Claude, and Copilot? Different engines, different playbooks.
What to sample, how often
For most B2B teams, a reasonable cadence is:
- 20–40 buyer-intent prompts, chosen carefully
- 5 engines (ChatGPT, Gemini, Perplexity, Claude, Copilot)
- Weekly cadence for the top prompts, monthly for the long tail
That's 500–1,000 probes per month. Doable manually if you love spreadsheets. Automated with a platform if you want your evenings back.
Building the instrumentation
Two shapes:
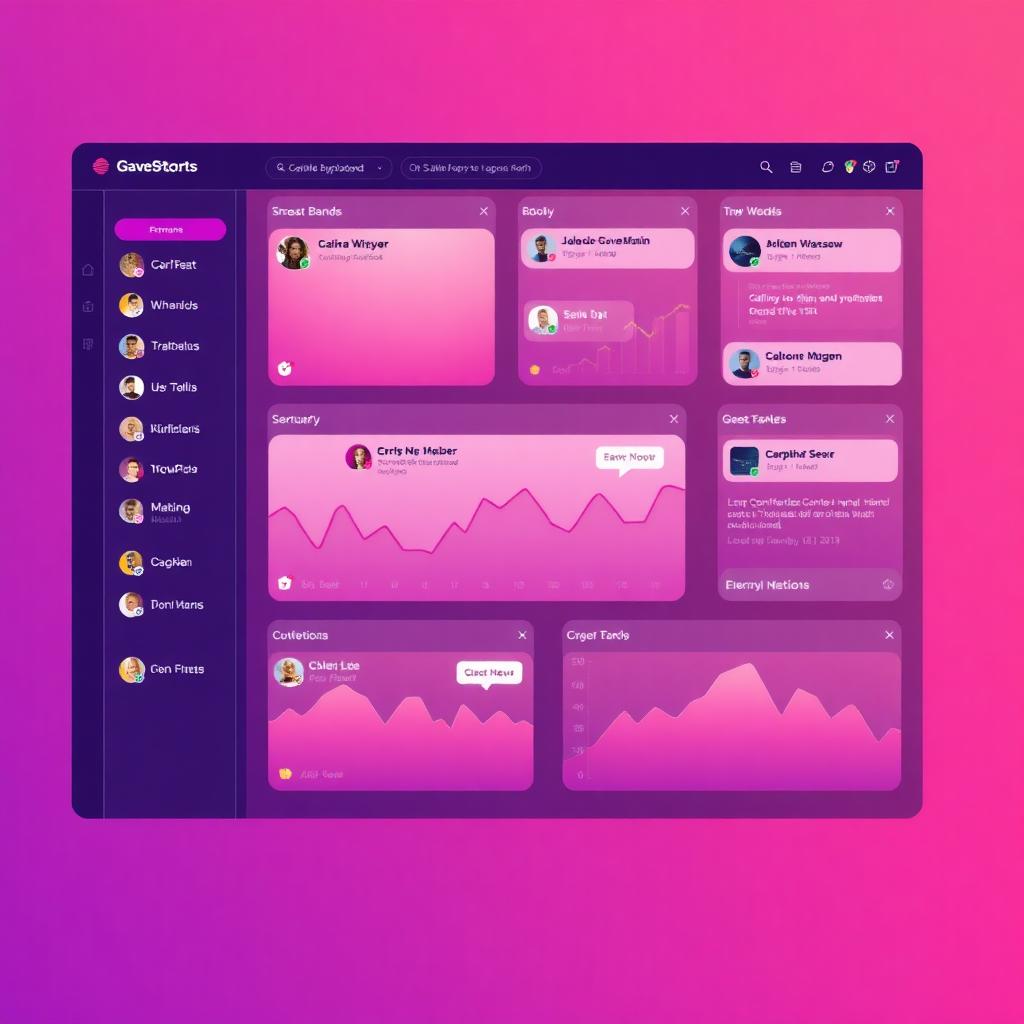
Roll your own. Use the OpenAI, Anthropic, Google, and Perplexity APIs directly. Query each with your prompts. Log responses. Parse for mentions. Set up dashboards.
Buy. Use a purpose-built AEO monitoring tool that handles the fan-out, parsing, sentiment, and diffing.
Either way, the goal is the same: a metric you can move.
Reporting that lands
CEO-facing AEO reports need three things:
- A single "AI visibility score" out of 100 — trendable over time
- A list of prompts you lost and to whom
- One concrete action for the next two weeks
Anything more is noise. Anything less is a status update, not a strategy.
The competitive angle
Your dashboard is not complete without competitor visibility. If you're gaining and your top competitor is gaining faster, that's important. If you're both flat and a new entrant is taking share, that's a fire drill.
Frequently asked questions
Why doesn't Google Analytics show AI answer traffic?
Because AI answers often replace the click. When a user reads the answer and doesn't visit your site, there's no session to log. Traditional analytics is downstream of the impression.
What's the single most important AEO metric?
Mention rate across a stable set of buyer-intent prompts. It's the closest proxy for the impression share you used to measure in SEO.
How many prompts should I track?
20–40 for most B2B teams. Enough to be statistically meaningful, few enough to actually analyze weekly.
Should I roll my own tracking or buy a tool?
Roll your own to learn the space (2–4 weeks of engineering). Buy once you outgrow spreadsheets — usually around the 3-competitor, 5-engine, weekly-cadence mark.
What's a healthy mention rate?
Under 20% is a fire drill. 20–40% is a real gap. 40–60% is competitive. 60%+ is defensible category leadership.
Key takeaways
- Traditional analytics is blind to AI answers — build a new instrumentation layer.
- Track mention rate, citation share, sentiment, prompt coverage, and engine drift.
- CEO reports need: one score, top lost prompts, one action for the next two weeks.
- Include competitor visibility — flat is a fire drill if a new entrant is climbing.